Theoretical Models of Bioengineering for Global Health
Summary
As genetic engineering becomes easier and cheaper, its potential for improving global health continues to grow. This theoretical model examines the potential application of a CRISPR-Cas9 gene drive to a population of Biomphalaria glabrata snails, the intermediate host for the neglected tropical disease schistosomiasis. This system is of special interest because these snails reproduce both sexually and asexually. This model shows the outcome of a gene drive in a scenario where asexual reproduction has to be considered.
Tools used in this demo: Python, pandas, NumPy, matplotlib, sensitivity analysis, population genetics, Markov process, parameter optimization
For more information about this system, see Grewelle et al. 2022.
This is a truncated Markdown version of a Jupyter Notebook. To view the full notebook, click here.
Table of Contents
The System
Schistosomiasis (SHI-stow-so-MY-ah-sis) is a parasitic worm disease that affects over 200 million people a year. Schistosomiasis is considered a Neglected Tropical Disease and a disease of poverty. Adult schistosome worms in humans can be treated with the anti-parasite drug praziquantel, but this drug does not prevent reinfection from contaminated waters. The schistosome worms spend a larval stage in freshwater aquatic snails. Targeting these intermediate hosts might reduce reinfection. Freshwater snail populations can be controlled with molluscicides, habitat control, biological control, and, theoretically, through gene drives.
Gene drives propagate a target gene through a population at a rate higher than the expected level of Mendelian inheritance. Within the realm of infectious disease control, some gene drives focus on spreading a lethal gene through that locally crashes a population. Other gene drives focus on spreading disease resistance through a population, making a disease less transmissible to humans, but otherwise leaving the population mostly intact. We will focus on this lattter type.
The Transision Matrix
To model this situation, we start with characterizing our alleles. Each allele is associated with a growth rate and a level of disease resistance. The two characteristics are related; disease resistance often comes at a cost to fecundity or competitive ability. So, an allele that confers disease resistance will have a lower growth rate. Gene drive alleles will also have a lower growth rate - both from the disease resistance and from the gene drive itself.
Alleles mix and match during reproduction to form genotypes, and we are interested in tracking the change of genotype proportions over time.The goal of this model is to observe how the population genetics of a snail population change over time (measured in generations of snails). To do this, we set up a transition matrix (Grewelle et al. 2022), which tracks how genotypes change from one generation to the next. The following algorithm constructs the matrix by examining all combinations of genotype crossings - both in sexual reproduction (or outcrossing) and asexual reproduction (or selfing).
def get_transition_matrix(genotypes, previous_gen_proportions):
    """Get the transition matrix - or, the probability that one

    :param genotypes: pandas DataFrame - contains the name of the genotypes (as a combination of allele letters),
                                        the genotype growth type, and the genotype disease resistance
    :param previous_gen_proportions: NumPy array - proportions of each genotype in the total population, from the
                                                    previous population. Used to find the likelihood of that two
                                                    genotypes encounter each other in sexual reproduction
    :return: tm: NumPy array - transition matrix, used to find the genotype population proportions in the next generation
    """

    # Framing the proportions in a dataframe we can call by genotype
    proportions = pd.DataFrame(previous_gen_proportions, index = genotypes)

    # Outcrossing transition matrix setup, dependent on the number of genotypes in our system (N_GENOTYPES)
    out_tm = np.zeros((N_GENOTYPES, N_GENOTYPES))
    out_tm = pd.DataFrame(out_tm, index = genotypes, columns = genotypes)

    # Generating the outcrossing transition matrix
    # genotype1 x genotype 2 --> genotype_nextgen
    # Rows: genotype1
    # Columns: genotype_nextgen
    for genotype1 in genotypes:
        for genotype2 in genotypes:
            for allele1 in genotype1:
                for allele2 in genotype2:
                    genotype_nextgen = allele1 + allele2
                    genotype_nextgen = "".join(sorted(genotype_nextgen)) # alphabetize the genotype
                    rate = np.mean([gdf.loc[genotype1]["Growth Rate"], gdf.loc[genotype2]["Growth Rate"]])

                    # Gene Drive Condition:
                    # If the nextgen genotype is heterozygous for the gene drive,
                    # then the efficiency rate GAMMA determines the outcomes
                    # - Most form a gene drive genotype 'GG' at a rate GAMMA
                    # - Some stay in the nextgen genotype at a rate (1-GAMMA)
                    if bool('G' in allele1) != bool('G' in allele2):
                        out_tm["GG"][genotype1] = out_tm["GG"][genotype1] + GAMMA * (1 / 4) * rate *
                                                    proportions.loc[genotype1][0] * proportions.loc[genotype2][0]
                        out_tm[genotype_nextgen][genotype1] = out_tm[genotype_nextgen][genotype1] + (1 - GAMMA) *
                                                                (1 / 4) * rate * proportions.loc[genotype1][0] *
                                                                proportions.loc[genotype2][0]
                    else:
                        out_tm[genotype_nextgen][genotype1] = out_tm[genotype_nextgen][genotype1] +
                                                                (1 / 4) * rate * proportions.loc[genotype1][0] *
                                                                proportions.loc[genotype2][0]

    # Selfing (asexual reproduction) transition matrix setup
    self_tm = np.zeros((N_GENOTYPES, N_GENOTYPES))
    self_tm = pd.DataFrame(self_tm, index = genotypes, columns = genotypes)

    # Generating the selfing transition matrix
    # genotype_self x genotype_self --> genotype_nextgen
    # Rows: genotype_self,
    # Columns: genotype_nextgen
    for genotype_self in genotypes:
        for allele1 in genotype_self:
            for allele2 in genotype_self:

                # Find the genotype we're working with and alphabetize it
                genotype_nextgen = allele1 + allele2
                genotype_nextgen = "".join(sorted(genotype_nextgen))
                rate = gdf.loc[genotype_self]["Growth Rate"]

                # Gene Drive Condition applies
                if bool ('G' in allele1) != bool('G' in allele2):
                    self_tm['GG'][genotype_self] = self_tm['GG'][genotype_self] + GAMMA * (1 / 4) *
                                                    rate * proportions.loc[genotype_self][0]
                    self_tm[genotype_nextgen][genotype_self] = self_tm[genotype_nextgen][genotype_self] +
                                                                (1 - GAMMA) * (1 / 4) * rate *
                                                                proportions.loc[genotype_self][0]
                else:
                    self_tm[genotype_nextgen][genotype_self] = self_tm[genotype_nextgen][genotype_self] +
                                                                (1 / 4) * rate * proportions.loc[genotype_self][0]

    # Combine the two transition matrices, applying the selfing rate (SIG) and the inbreeding cost (INBR)
    tm = (1 - SIG) * out_tm + SIG * INBR * self_tm

    return tm
The Genotypes over Time
We can use this transition matrix if we are given an initial population and some starting conditions. (Reminder: you can see the full system here.) Now, we can observe how the genotypes change over several generations. If the gene drive works well, then the proportion of snails homozygous for the gene drive (genotype GG) should rise fairly quickly.
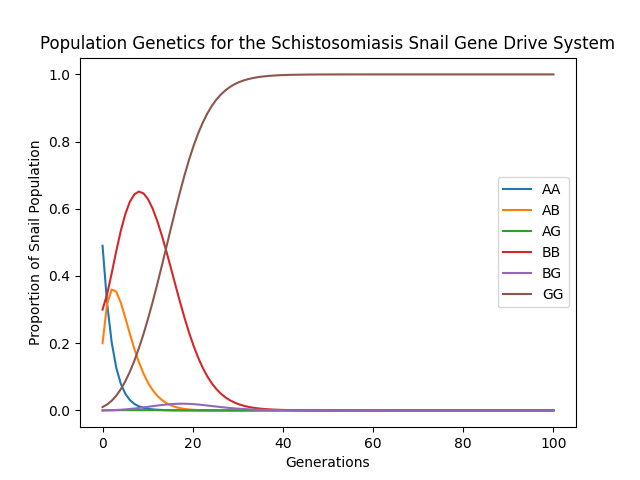 Figure 1. Genotype proportions in a snail population over time. The homozygous gene drive genotype GG rises to fixation within 40 generations. The high infection levels favor the resistant and less costly BB genotype for a while, but the selfish genetic element of the gene drive eventually causes the GG genotype to dominate the population. Even though the G allele shares the same level of resistance and incurs more fitness cost than the B allele, the non-Mendelian inheritance pattern of the G allele wins out in the end.
The Next Steps
This exercise demonstrated what would happen to a theoretical population of freshwater snails after a gene drive is introduced to the population. How, then, can we use the information given by this model? One thing we can do is run a sensitivity analysis to assess which parameters contribute the most to the success of the gene drive, as measured by the percentage of GG genotype by generation 100. This can give us input about how and where to apply a gene drive. For example, if the most senstive parameters are dependent on external conditions (such as β, the infection rate; or r, the growth rate), then the success of the gene drive may lie in local environmental conditions. If the most sensitive parameters are dependent on genetic conditions (such as g, the gene drive efficiency; or ξ, the level of disease resistance), then the success of the gene drive may lie in the design of the gene drive itself.
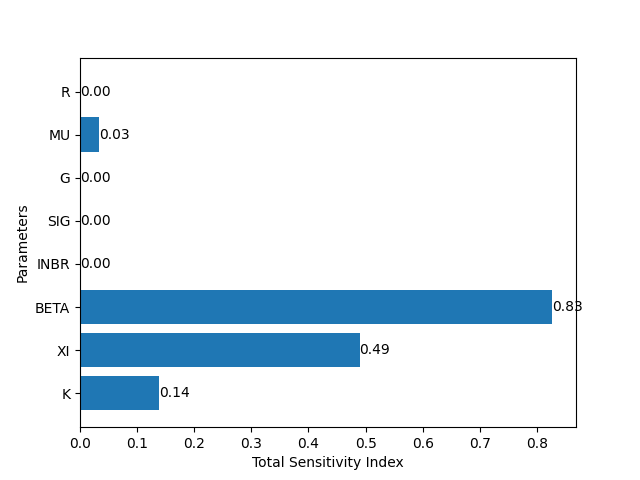 Figure 2. Sobol sensitivity analysis, measuring the sensitivity of all of the parameters to the number of infected snails at t=99. The parameter with the highest sensitivity index is beta, or β the force of infection on the snails. This suggests that the higher the infection level in the environment, the more successfully a resistance-inducing gene drive will perform!.